

Performance DJIA:
Mon 5/4 +0.11%
Tues 5/5 +0.56%
Wed 5/6 -0.91%
Thurs 5/7 +0.89%
Fri 5/8 +1.91%
Last week +2.56% (4 weeks in a row, very little change)
Since 2/19 market high -17.09%
Bond model you are in:
Last week +0.12%
Since bought in -0.36%
Tid Bits:
1. V shape, versus W shape, versus U shape (bottom of the U isn’t going to be smooth)
a. We currently look like a V (3 data points). A high, a low, and where we are at currently.
b. With so much economic backlash obviously to come, we haven’t heard a single analysts predict a V shaped market recovery.
c. Market corrections in their entirety typically look like a V or a U shape when looking at a graph of the entire cycle start to finish. Though, when you zoom in and look at narrow timeframes, more specifically during their mid stages, they are not smooth or flat by any means. They typically have more of a W shape to them with several ups and downs in the market.
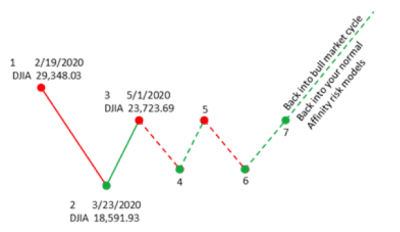
2. Data points. This is another one of our terms here in the office, not necessarily industry terms as we look to use verbiage that the majority of our clients will easily understand. We have had 3 data points so far and are waiting on the 4th.
a. First data point, market hits all time highs, 29,348 February 19, 2020.
b. Second data point, market has a fast drop to 18,591 by March 23, 2020
c. Third data point, where we are today. The market is hovering between 22,000 and 24,000.
i. Its like the market has priced in various things and waiting for the next blast of bad news to have the next dip.
ii. This next dip is where we look to “Cycle Trade”. Taking our fee based accounts, IRAs, Roth, Non-IRAs, all above $25,000 in account value, and selling out of 50% of the bonds, and going into 50% stocks. Ultimately diversified in a 50/50 stock/bond mixture. Using the stock side to take advantage of the data points moving from the 4th data point, to the 5th data point. That way we can manage risk by maintaining 50% in bonds for stability.
iii. This “buying in” of “cycle trading” will be a day by day situation. See what the drops are like, how many days in a row, how fast the drops are coming, and what is the information and news behind this so we can make an informed and calculated decision.
iv. When we get to a 5th data point, meaning the market had a bounce up, then we will sell out of those stocks and go back to 100% bonds until we get to the next data point.
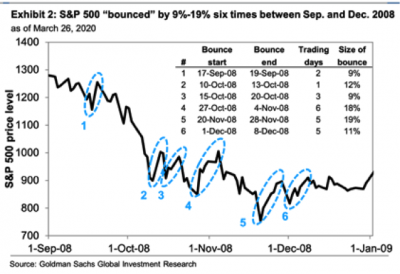
3. As we all know, past performance and trends do not guarantee future performance and trends. It is common to see surges/rallies in the market after stimulus bills and monetary policy are put into place. For perspective, the $2.7T total of stimulus CARES packages equate to 12% of our annually GDP (a little less than 2 months worth of annual GDP). The chart below reflects 6 market surges/rallies of +9% or better after the 2008 stimulus package (TARP). The lowest low in the market didn’t happen until March 9th of 2009, several months later. This was described as a U shaped market. A U shaped market implies that the market goes down and stays down before coming back up. During the bottom months of the U, it is not smooth or flat and has many ups and downs, giving it more of a W shaped look. THIS is where we intend to “cycle trade” and take advantage of future market swings.
Facts:
1. Coronavirus
Global 4,210,407cases 284,451deaths
US 1,368,036cases 80,789deaths (+12,180, 17% increase from last week)
KS 6,953cases 174 deaths
MO 10,008 cases 497 deaths
2. Nonfarm payrolls fell by 20.5 million and the unemployment rate spiked to 14.7%, the highest rate on record back to January 1948. Job losses were concentrated in industries directly impacted by this crisis or tied to social distancing. Leisure and hospitality had the sharpest decline of 47%, or 7.7 million jobs.
3. From mid-March through the end of April, 44 companies in the S&P 500 either cut or suspended their dividends, according to S&P Dow Jones Indices. Those moves reduced the S&P 500’s overall dividend payment by 6.5%.
Highlights from analysts and economists:
1. From JP Morgan
a. The April employment report carved out the left-hand side of a U-shaped recession in brutal fashion. The longer this downturn persists, the more companies so far only indirectly impacted by this crisis will be forced to lay off workers due to cash flow and profitability pressures. Therefore, the unemployment rate could rise over the next few months before drifting down slowly by the end of the year, but it is likely to remain in the double digits entering 2021.
b. 1Q20 real GDP fell 4.8% q/q at a seasonally adjusted annual rate, essentially marking the start of a sharp recession as a result of a halt in economic activity in order to contain the spread of COVID-19. The fall in economic growth reflected negative contributions from consumption, business fixed investment, exports and inventories, but positive contributions from housing and government spending. This decline in real GDP growth is consistent with our forecast of a U-shaped recession, or a fall, a stall and a surge.
2. From Blackrock
a. The municipal market regained a semblance of normalcy in April. Federal stimulus and bargain prices sparked a pickup in demand by mid-month, but the overall tone of the market remained cautious as the economic impact of the COVID-19 pandemic is yet to be measured.
3. From Alliance Bernstein
a. Munis rebounded the first week of May, offsetting most of the loss experienced in April. Demand picked up as net mutual fund flows were positive, although high-yield flows remain negative.
4. From American Century
a. Economic growth will be pressured, but we expect the U.S. to remain stronger than other developed markets.
b. Accommodative central bank policy is positive for emerging markets but may not be enough to calm the headwinds they face.
c. Energy sector valuations may appear tempting, but we expect continued volatility and recommend investors tread carefully.
d. We expect continued robust demand for Treasuries, which should support higher-quality bonds and ultimately help improve valuations among corporate bonds.
5. From Wall Street Journal
a. Businesses Struggle to Lure Workers Away From Unemployment [This was sooo predictable!]. Some workers are making more from unemployment than at their old jobs, complicating reopening’s
6. From MarketWatch
a. April produced the best monthly gains for the Dow Jones Industrial Average DJIA, -0.57% and S&P 500 SPX, -0.21% in 82 years — after the worst first quarter in history — and May has so far got off to a bad start. Former Goldman Sachs analyst Will Meade said the rest of the year looked even worse for stocks, predicting a 40% drop over the rest of 2020. Meade said the year was lining up to be “exactly like” the 2000 dot com bubble crash. “The Nasdaq in 2000 did a similar bear market bounce as stocks this year — dropped 40%, then bounced 42% off the bottom retracing 61.8% of its drop. It stalled then fell 43%, making a new low four months later,” Meade said. He added that the presidential election on the horizon, as it was in 2000, creates further risk and uncertainty, while retail participation and leverage was near the 2000 bubble level. Finally, the fact Warren Buffett was hoarding a “record amount of cash,” as he did in 2000, was another sign of what’s to come, he said.
Opportunities:
1. Community Café is Wednesday, May 13th at 8:00am for 30 minutes. Topic will be Asset Allocation and Affinity’s Investment Committee (behind the curtain look at building and managing portfolios)
Will live stream on Facebook Live
Email invitations were sent to join on the Zoom.com platform
Co-hosted by Chris Toman with First Option Bank
2. Estate Planning webinar on Tuesday, May 12th at 12:00 noon for 1 hour and 15 minutes
Pros and cons of a Will based estate plan
Pros and cons of a Trust based estate plan
Co-hosted by Glenn Stockton with Stockton & Stern Law firm
Interested in attending? Please email Stacy at [email protected]
3. Referrals – Please share us with your loved ones
4. Roth Conversions
5. Taking withdrawals
a. We never want to discourage you for taking withdrawals. However, the more you leave in the account, the more you will have working for you in our diversified investment mixture when the market goes up. If you need money always feel free to give us a call so that we can collaborate on what is best for your specific situation
6. If you are still working, call your 401K company, (not your HR department of your employer) and ask if you have access to an “in-service rollover”. And if you do, let us know ASAP as there are potential large benefits that you don’t have at work in that 401K.
Reminders:
1. Don’t forget that the news creates drama. The stock market moves for 2 reasons which are greed and fear.
2. Any service work you would like us to do for you, please email your request to us.
3. We are being told by our broker/dealer, Client One Securities (CIS), that your brokerage accounts should now be able to integrate with your personal tax software for those who do their own tax returns. Any problems or questions on this, can be directed to C1S directly at 913-814-6097
Please feel free to share this email and/or the teleconference information as the best way to battle anxiety is education
Next Teleconference: No guest speaker this day
Wednesday 5/13/20
800-747-5150
Passcode : 3814800# (must hit the # at the end)
2:00pm CST
Thank you for your time in reading these updates.
Please share them with anyone you want to help
Stay safe and stay healthy.
Mark Roberts/Angela Hudson