

Investment Commentary – March 24, 2021
Year to Date Market Indices as of March 24, 2021
• Dow 32,627 (5.94%)
• S&P 3,913 (4.11%)
• NASDAQ 13,215 (2.63%)
• Gold $1,731 (-9.02%)
• OIL $59.27 (22.35%)
• Barclay Bond Aggregate (-3.45%)
• Fed Funds Rate 0-0.25 (0-0.25)
JP Morgan Economic Update
Growth
4Q20 real GDP grew at a 4.1% q/q seasonally adjusted annual rate, with increases in consumption, housing, business fixed investment, inventories and exports, partially offset by declines in government spending and increasing imports (a subtraction from real GDP). Economic output still remains 2.5% below peak 4Q19 real GDP, though additional fiscal stimulus should support growth going forward. The February ISM Manufacturing PMI came in at 60.8, indicating the strongest output growth since 2018. In contrast, the Services PMI showed more subdued activity, but we expect to see a resurgence as the economic reopening accelerates.
Jobs
Nonfarm payrolls increased by 379,000 in February, nearly doubling consensus expectations. Notable gains occurred in restaurant and food service hiring, adding 286,000 jobs this month, as lockdown restrictions have eased. The gains are particularly impressive given the tough weather conditions in February, which likely explains the fall of 61,000 jobs in construction employment. The unemployment rate edged to 6.2% and wages rose 0.2% m/m and 5.3% y/y for all workers. The labor market will continue to improve as the pandemic recedes and as Washington passes further fiscal stimulus. We will be watching for gains in labor force participation for signs of a durable recovery in the labor market.
Profits
The 4Q20 earnings season wrapped up with 497 companies having reported (99.7% of market cap). Our current estimate for 4Q20 earnings is $38.70 with EPS declining 1.2% y/y. Thus far, 79% of companies have beaten on EPS estimates, and 67% have beaten on revenue estimates. Further economic recovery, positive vaccine developments and a weaker dollar (-6% y/y) helped 4Q earnings, but lower oil prices (-30% y/y) were a headwind. Earnings grew in technology and health care, while financials, energy and industrials struggled the most.
Inflation
Headline CPI for February rose +0.4% m/m and +1.7% y/y, while core inflation came in below forecasts at +0.1% m/m and +1.2% y/y. The PPI index for February also rose by +0.5% m/m and +2.5% y/y, in line with estimates. Energy and food prices both posted solid gains in this week’s inflation prints. While these prints show somewhat subdued inflation, the surge in the ISM Prices Paid Index last week, indicating pricing pressure on production inputs, and the OPEC+ decision to keep supply unchanged suggest higher inflation ahead.
Around the Web
Fed forecast: The U.S. Federal Reserve upgraded its economic growth outlook as well as its inflation forecast, although it reiterated its expectations that it will keep interest rates at ultralow levels well into the future. In fact, a majority of Fed members expects to see short-term rates stay near zero through 2023.
Calming trend: Although the U.S. stock market has recently seen some significant daily moves, a measure of investors’ expectations of short-term volatility has slipped to the lowest level in about 13 months. On Wednesday, the Cboe Volatility Index closed at 19.2—the lowest since the pandemic triggered a spike in volatility.
YTD yield surge: Inflation concerns continued to weigh on bond prices, pushing the yield of the 10-year U.S. Treasury bond above 1.70% for the first time since January 2020. At the end of last year, the yield was just 0.92%.
Oil loses traction: The price of U.S. crude oil tumbled about 8% on Thursday—the commodity’s biggest single-day decline in about six months—before rebounding modestly on Friday back above $61 per barrel. Thursday’s decline came amid new data showing abundant global oil supplies and concerns that oil demand in Europe could falter amid a bumpy rollout for COVID-19 vaccinations there.
Upcoming Events
Thursday
Weekly unemployment claims, U.S. Department of Labor
Third-quarter GDP, third estimate, U.S. Bureau of Economic Analysis
Today in Stock Market History: March 24:
2000: The Standard & Poor’s 500-stock index sets a new record high of 1527.46, reaching a total market value of $12.931 trillion. Over the next year, it proceeds to lose 24% of its value, or roughly $2.5 trillion.
The views presented are not intended to be relied on as a forecast, research or investment advice and are the opinions of the sources cited and are subject to change based on subsequent developments. They are not a recommendation, offer or solicitation to buy or sell any securities or to adopt any investments.
https://www.marketwatch.com/ (Market Indices)
https://jasonzweig.com/this-day-in-financial-history/ (This day in Financial History)
https://www.jhinvestments.com/weekly-market-recap (Around the Web & Upcoming Events)
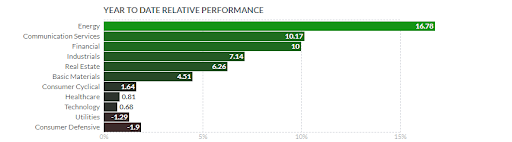
https://finviz.com/groups.ashx (YTD Performance Chart)
https://am.jpmorgan.com/us/en/asset-management/adv/insights/market-insights/market-updates/economic-update/