Investment Commentary –August 28, 2018
Year to Date Market Indices as of Market Close August 28, 2018
Dow 26,064 (5.44%)
S&P 2,897 (8.37%)
NASDAQ 8,030 (16.32%)
Gold $1,207 (-9.19%)
OIL $68 (17.13%)
Barclay Bond Aggregate (-0.77%)
Fed Funds Rate 2.0% (last increase was 6/13/18)
Boom! US economy logs best performance in nearly 4 years
U.S. economic growth was a bit stronger than initially thought in the second quarter, notching its best performance in nearly four years, as businesses boosted spending on software and imports declined.
Gross domestic product increased at a 4.2 percent annualized rate, the Commerce Department said on Wednesday in its second estimate of GDP growth for the April-June quarter. That was slightly up from the 4.1 percent pace of expansion it reported in July and was the fastest rate since the third quarter of 2014.
Businesses spent more on software than previously estimated in the second quarter and the nation also imported less petroleum. Stronger business spending and a smaller import bill offset a small downward revision to consumer spending.
Compared to the second quarter of 2017, the economy grew 2.9 percent instead of the previously reported 2.8 percent. Output expanded 3.2 percent in the first half of 2018, rather than 3.1 percent, putting the economy on track to hit the Trump administration’s target of 3 percent annual growth.
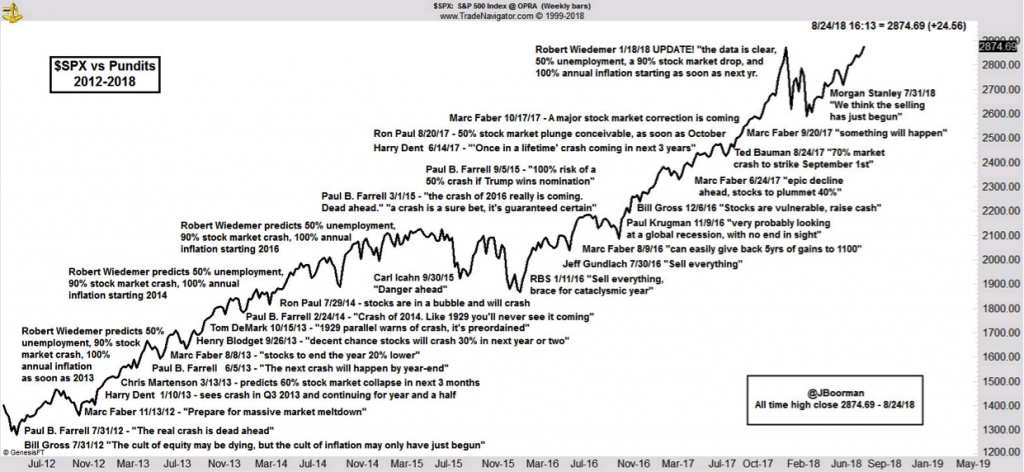
Chart of shame: The S&P 500 vs. everyone who said the market was about to crash
Let’s call it the chart of shame.
Jon Boorman, technical analyst and portfolio manager for Broadsword Capital, has been tracking this bears vs. the S&P 500 SPX, +0.03% battle for a while now, and, needless to say, it’s been a lopsided affair.
Boorman, in the “chart of the day” highlighted in our daily “Need to Know” column, calls out the likes of former congressman Ron Paul, who last year forecast a 50% correction, and MarketWatch’s own Paul Farrell, who predicted a “100% risk of a 50% crash if Trump wins the nomination.”
Then there’s the epic “sell everything” calls from RBS in January 2016 and again from Jeff Gundlach a few months later. The most recent fail came from Morgan Stanley MS, +0.22% , which forecast “the selling has just begun” in July.
One thing they all have in common: Complete wrongness.
Boorman, in a blog post accompanying an earlier iteration of the chart, tried to soften all the blows landed in his bear beatdown.
“I hope they all have a sense of humor, and I imagine that, given most are in the public eye, they already have a fairly thick skin, as it must be hard to take the heat they do in such an unforgiving arena,” he said. “And yet many still try their hand, unbowed by the relentless bull market before us.”
The bears will undoubtedly have their moment, but that moment is not today. The S&P and Nasdaq Composite COMP, +0.15% extended their push into uncharted territory, while the Dow Jones Industrial Average DJIA, +0.06% edged within 2% of its all-time high.
Around the Web:
Trade fight lingers: Trade talks between mid-level U.S. and Chinese officials failed to yield any clear signs of progress toward ending the recent round of retaliatory tariffs. As the talks wrapped up, the United States imposed tariffs on an additional $16 billion in Chinese goods. China responded with tariffs affecting a roughly equivalent amount of U.S. products.
Steady Fed: Wednesday’s release of minutes from the U.S. Federal Reserve’s most recent policy meeting bolstered expectations that officials are likely to raise interest rates again at their next meeting, which opens on September 25. On Friday, Fed Chairman Jerome Powell spoke in Jackson Hole, Wyoming, where he defended the central bank’s plan to raise rates gradually.
Long time coming: The S&P 500 took its time in setting a new record high relative to the rapid succession of new records established over the past couple years. The nearly seven months needed to beat the index’s prior record was the longest such period since July 8, 2016, when the S&P 500 ended a stretch of more than 13 months without setting a record high.
Other Notable Indices (YTD)
Russell 2000 (small caps) 13.42
EAFE International -1.38
Emerging Markets -2.89
Shiller Annuity Index 12.91
The week ahead:
Wednesday
Second-quarter GDP, second estimate, U.S. Bureau of Economic Analysis
Pending home sales, National Association of Realtors
The views presented are not intended to be relied on as a forecast, research or investment advice and are the opinions of the sources cited and are subject to change based on subsequent developments. They are not a recommendation, offer or solicitation to buy or sell any securities or to adopt any investments.
https://www.marketwatch.com/story/the-road-to-fresh-stock-market-highs-is-littered-with-these-awful-correction-calls-2018-08-28
https://www.cnbc.com/2018/08/29/second-estimate-of-q2-2018-gdp.html


