
Investment Commentary –October 25th, 2023
Year to Date Market Indices as of October 25th, 2023
• Dow 33,053 (2.31%)
• S&P 4,188 (13.32%)
• NASDAQ 12,820 (22.73%)
• OIL $85.39 (6.06%)
• Barclay Bond Aggregate (1.15%)
• Gold $1,994 (8.98%)
Why Holding Too Much Cash on the Sidelines Can Set You Back
Having too much cash sitting on the sidelines in a money market fund might seem like a safe move. But history shows there’s an opportunity cost to playing it too safe. Simply put, cash has less growth potential and most likely won’t help you reach your long- term goals. Here’s some practical advice to help you stay invested and funnel idle cash back into the market in a prudent way.
The opportunity cost of holding cash
The bar charts below show how little growth an all-cash portfolio produced compared with a traditional 60/40 balanced portfolio over five years and then extended over three decades. Investors who employed a systematic investing approach and regularly contributed to a diversified investment account with a healthy mix of stocks and bonds generated much higher returns. The all-cash investor, despite the perceived safety of cash, left a lot of money on the table. Even with periodic market downturns, history shows that markets eventually rebound, recoup their losses, and ultimately move higher and outperform cash by a wide margin. A systematic approach to investing helps control emotions, puts your savings on autopilot, and allows you to benefit from compounded returns.
STEADY CONTRIBUTIONS TO A 60/40 PORTFOLIO—RATHER THAN CASH—PRODUCED A BIGGER BALANCE OVER THE SHORTER AND LONGER TERM
An investor using a systematic investment strategy who invested $12,000 in a 60/40 (stocks/bonds) portfolio at the start of every year, or $1,000 at the beginning of each month, for five years or 30 years, would have generated a larger nest egg than an investor who executed the same strategy but stashed the money in a cash account over those time periods.
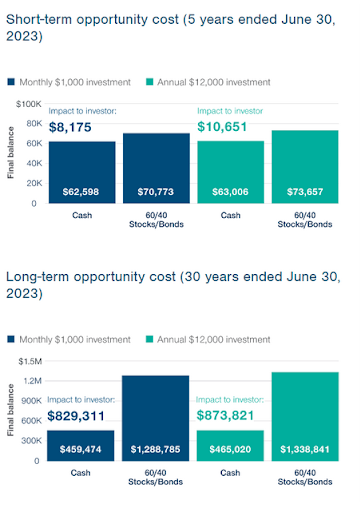
Sources: T. Rowe Price, created with Zephyr StyleADVISOR; S&P; Bloomberg Index Services Ltd. See Additional Disclosures.
Past performance cannot guarantee future results. It is not possible to invest directly in an index. Chart is shown for illustrative purposes only. Stocks: S&P 500 Index, bonds: Bloomberg U.S. Aggregate Bond Index, and cash: Bloomberg 1–3 Month Treasury Bill Index. As of June 30, 2023.
The views presented are not intended to be relied on as a forecast, research or investment advice and are the opinions of the sources cited and are subject to change based on subsequent developments. They are not a recommendation, offer or solicitation to buy or sell any securities or to adopt any investments.
https://www.marketwatch.com/ (Market Indices)
https://www.jhinvestments.com/weekly-market-recap (Around the Web & Upcoming Events)
https://finviz.com/groups.ashx (YTD Performance Chart)
https://www.jhinvestments.com/weekly-market-recap#market-moving-news
https://www.cnbc.com/2023/06/12/stock-market-today-live-updates.html
https://www.troweprice.com/financial-intermediary/us/en/insights/articles/2023/q3/why-holding-too-much-cash-on-the-sidelines-can-set-you-back.html